
Logs and activity
The side menu has two screens for diagnostics: Logs and Activity.
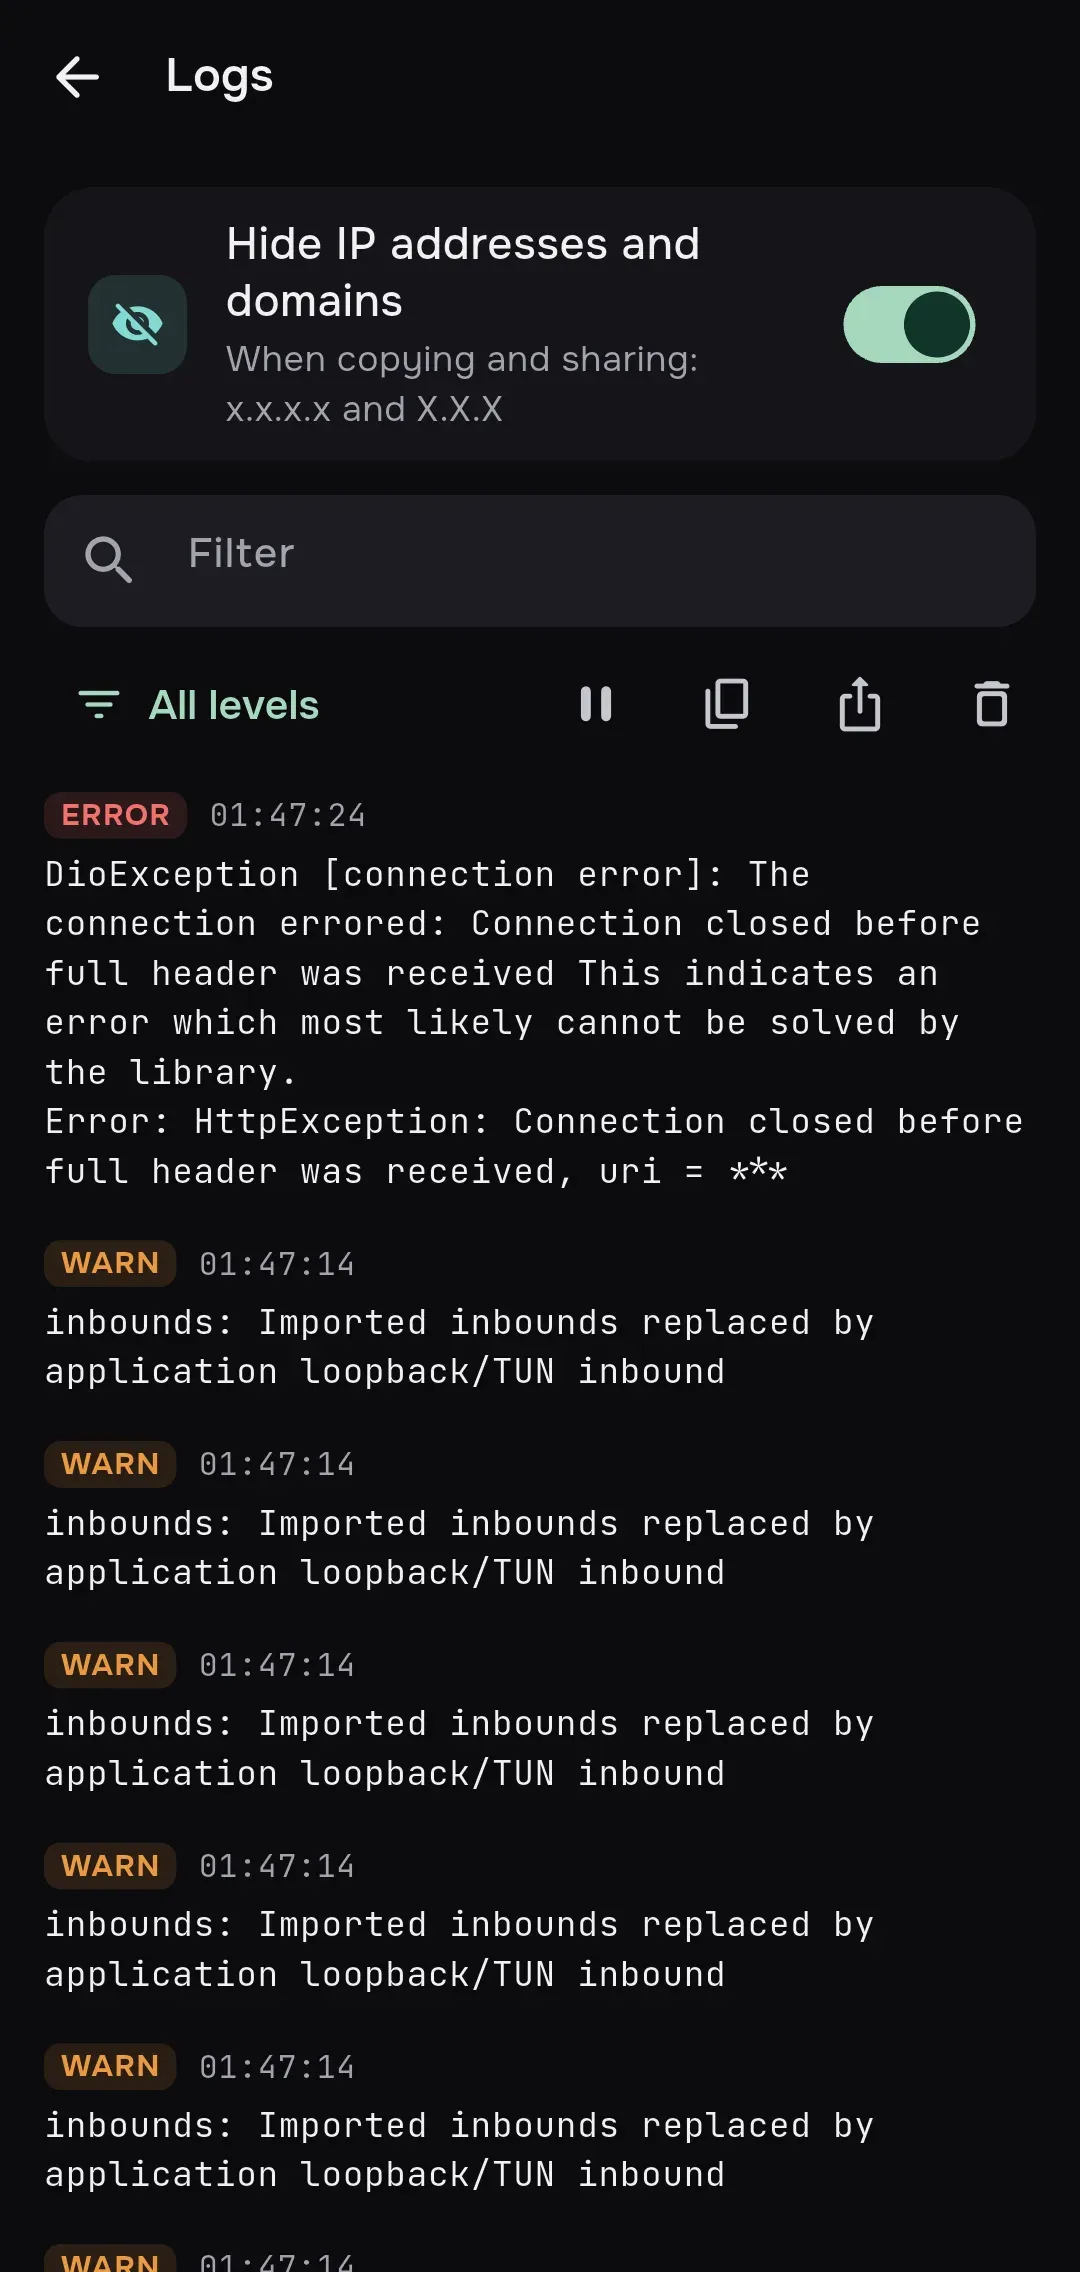
The log shows events of the engine and the app: connection start and stop, configuration warnings, subscription update and ping errors. The newest entries are on top. Each entry has a level, a time and a message. You can select and copy the message.
The log lives in memory only: the last 1000 entries, and it is empty after the app restarts. Before you connect the screen says “The log is empty. Entries appear after you connect”.
Hiding addresses
Section titled “Hiding addresses”The Hide IP addresses and domains switch is on by default. The hint under it reads: “When copying and sharing: x.x.x.x and X.X.X”. Masking replaces IP addresses with x.x.x.x and domains with X.X.X:
- it applies only when you copy or share the logs; on screen the entries are shown as they are;
- file names with common extensions (for example
geoip.dat) are not treated as domains and are not masked.
If you turn the switch off, the app warns you: “Share real addresses? Copied and shared logs will contain the IP addresses and domains of your servers and of the sites you opened. Share them only with people you trust.” Confirm with Show addresses.
Regardless of the switch, keys, passwords, tokens, UUIDs and long opaque strings are replaced with *** already when an entry is written to the log.
Filters and actions
Section titled “Filters and actions”- The Filter field searches the messages for a substring, ignoring case.
- The level button opens a choice: All levels,
trace,debug,info,warn,error. Only entries of the chosen level are shown. - Pause freezes the list on screen. New entries keep accumulating, and Resume returns to live mode.
- Copy puts the entries on screen (with the filter and level applied) on the clipboard, oldest first.
- Share redacted logs sends the whole log as a
mins-redacted.logfile through the system share menu. - Clear deletes all entries.
The level from which the engine writes to the log is set in Settings → Advanced → Diagnostics → Log level (info by default, see the Settings reference).
Activity
Section titled “Activity”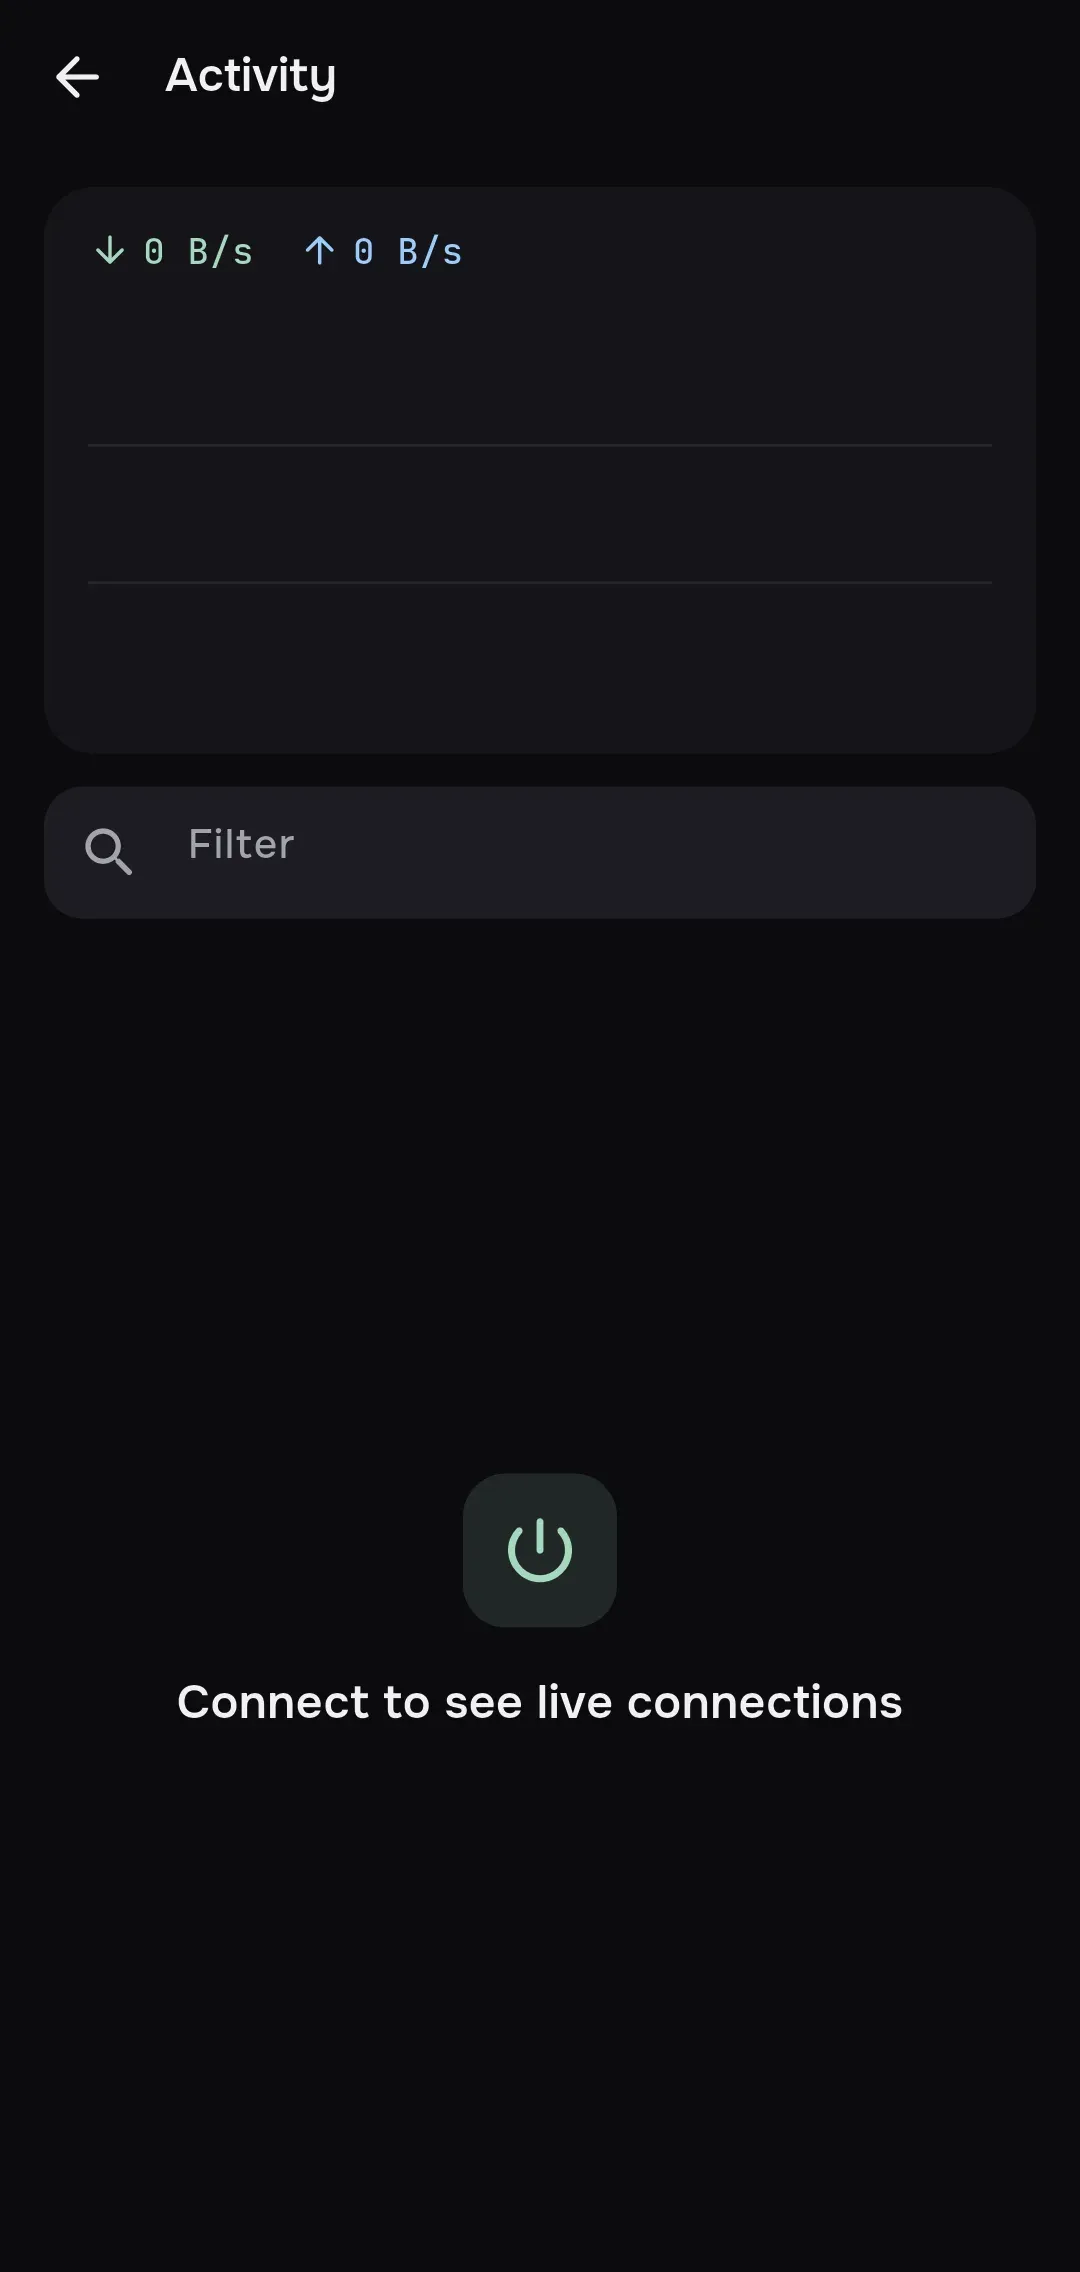
The Activity screen shows the running connection in real time. While mins is not connected it says “Connect to see live connections”.
The chart covers the last 60 seconds: download speed (in the accent color) and upload speed (blue), with the current values in the Download and Upload legend. The data refreshes once a second while the app is open on screen.
Below is the list of connections. Each row shows:
- the destination: the site name if mins could determine it, otherwise the address;
- a route tag: direct, proxy, DNS or block;
- the name of the rule that matched, if any;
- transferred and received traffic (↑ and ↓);
- the time the connection was opened.
The cross button (Close connection) drops the selected connection. The Filter field searches all the data of a connection. When there are no connections the screen says “No active connections. Connections appear once apps start sending data”.
The tags help you check routing: if a site goes “direct” when it should go through the proxy, look at the rule name in the row.